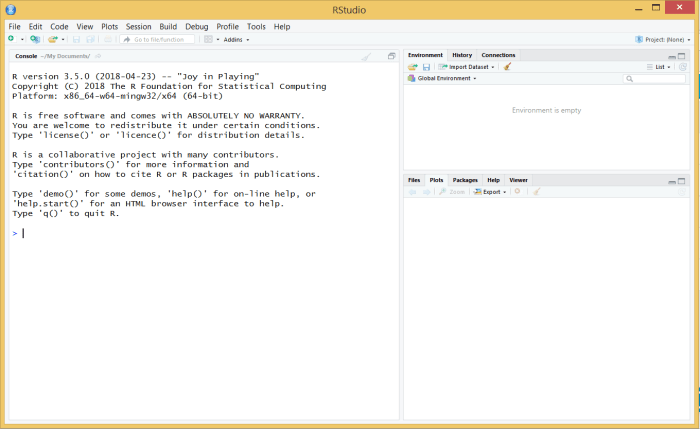
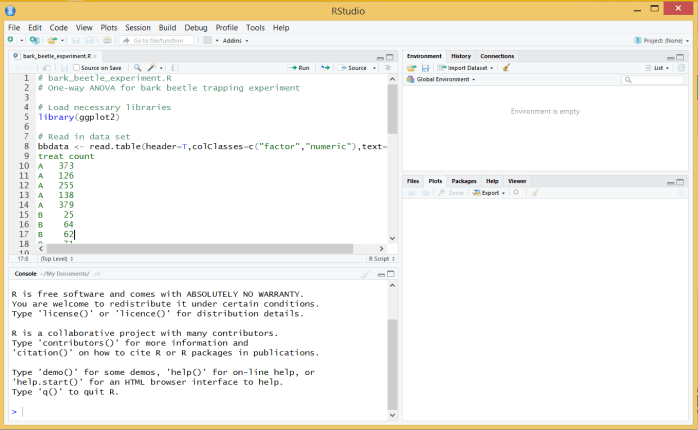
This page presents a brief explanation of how to run an R program using RStudio. Launch RStudio, and you should get an initial screen resembling Fig. 1 below.
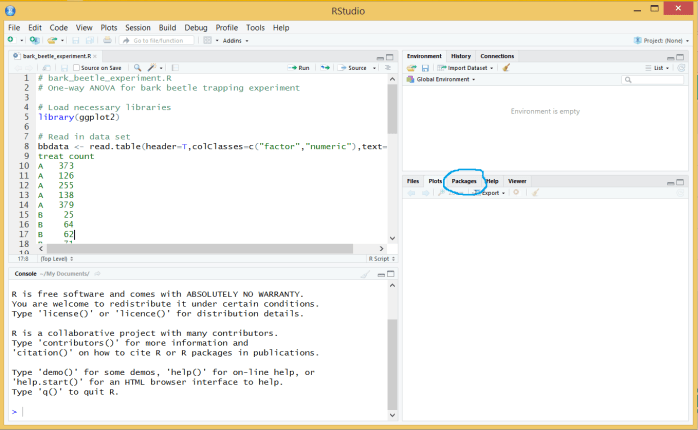
Use the File menu to navigate to a directory/folder containing an R program, in this case bark_beetle_experiment.R from Chapter 11 of the textbook, and open the file. The program will be load into the Editor pane (see Fig. 2).
Note that the editor color-codes different parts of the program, which is useful in finding syntax errors.
The fifth line of the program contains a library statement, which loads a package called ggplot2 that is useful for generating various kinds of graphs. This package is not part of the base R software, and must be installed before running the program. To see if it is installed, click on the Packages tab in the lower right pane (see circled area in Fig. 3). You should then see a list of packages already installed (Fig. 4). If ggplot2 is on this list, you already have this package.
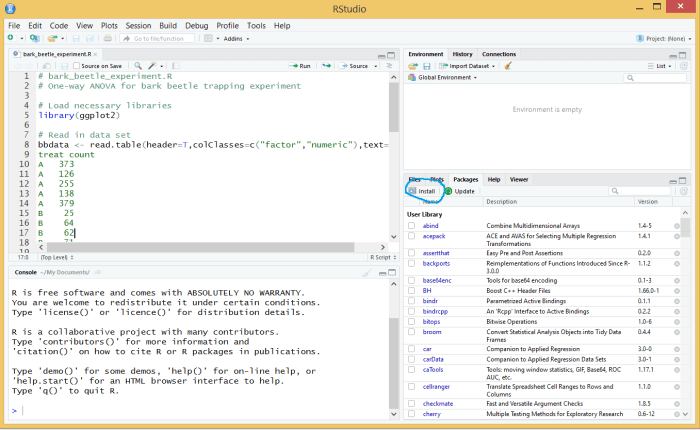
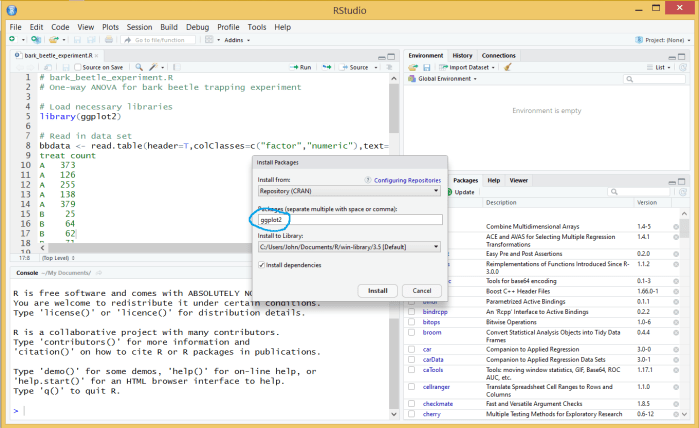
If the package is not present, click on the Install button (see circled area in Fig. 4) and type in the name of the package in the dialog box (Fig. 5). Click Install to then download and install the ggplot2 package. This process requires an internet connection. You only need to install a package once for it to be available in other RStudio (or R) sessions.
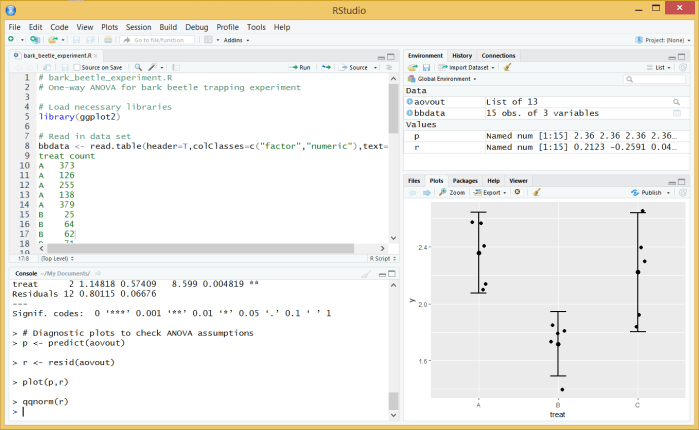
We are now ready to run the R program. To execute the entire program, we can use the Source button ( ) at the top of the Editor pane. The printed output will appear in the Console pane in the lower left, while the graphs appear in the Plots tab of the lower right pane (Fig. 6).
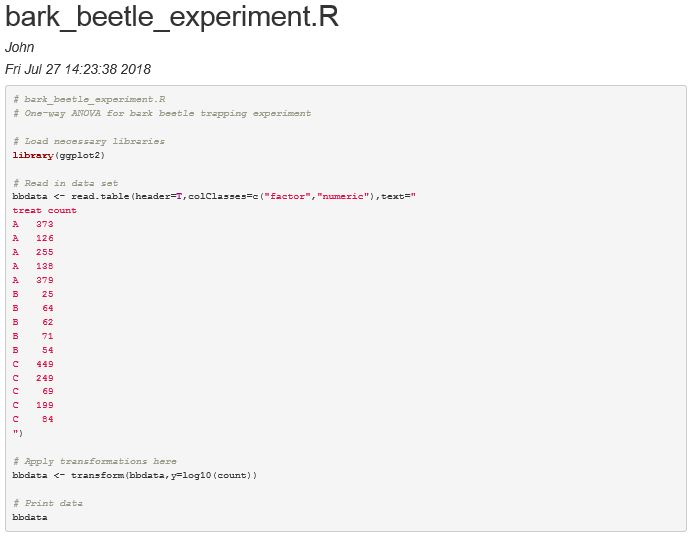
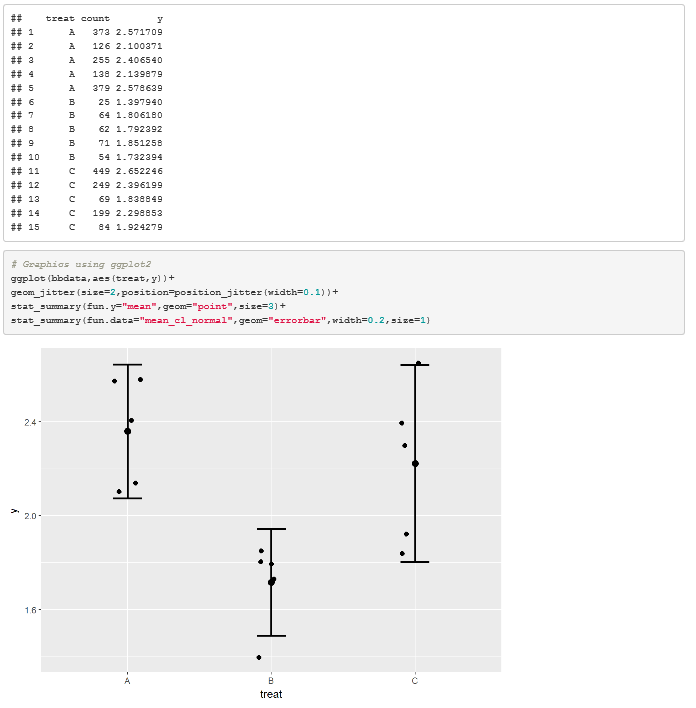
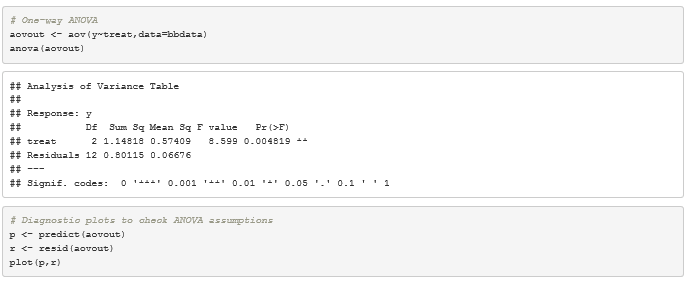
You can also generate output that combines the program code, printed output, and graphs using the Compile Notebook button ( ) at the top of the Editor pane. After clicking this button, you are offered a choice of different output formats, such as Microsoft Word, html, or pdf. Figure 7 shows the output of this program in html format. The shaded rectangles contain R code, while the unshaded ones are printed output. A graph is also embedded in the html output.